Facebook continues to dominate the global digital ecosystem in 2025, with over 3 billion monthly active users, making it the most widely used social platform despite the rise of TikTok and Instagram Reels. This unprecedented scale offers marketers massive reach across diverse demographics, especially in mobile-first countries like India, Indonesia, and the Philippines. Facebook user statistics 2025 show that the largest age group remains 25–34, while Gen Z is still active but splits attention across platforms. Engagement trends vary by region, with users in Southeast Asia and Africa spending the most time on the app. While Facebook’s engagement rate (0.15%) lags behind video-first platforms like TikTok, video content especially Reels remains the top performer, benefiting from algorithmic preferences and mobile optimization. Successful strategies now prioritize consistent, high-quality video-first content, strategic posting times (like Wednesday mornings), and partnerships with nano and micro-influencers who deliver stronger trust and ROI. Understanding facebook statistics, digital demographics, and user engagement trends is essential for crafting impactful marketing in Meta’s evolving ecosystem.
1. Facebook Passes 3 Billion Monthly Users in 2025
Facebook’s monthly active user base has officially surpassed 3 billion, maintaining its position as the most widely used social platform on the planet.
Key Implications
- Massive potential reach for advertisers and Facebook followers
- Continued dominance despite competition
- Strengthened role in cross‑platform ecosystems (Meta’s apps)
Audience Insight: No other platform gives marketers access to such a wide and demographically diverse community.
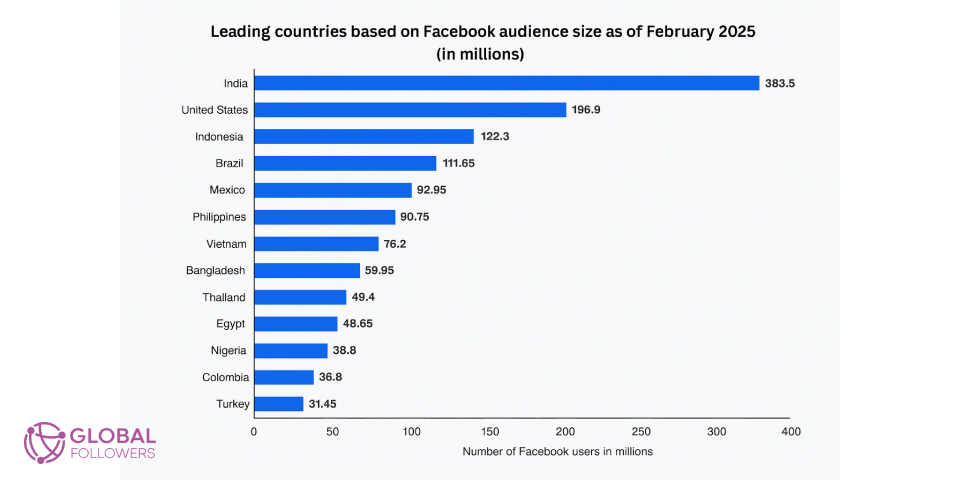
2. Global Distribution: Where Facebook Users Come From
Facebook’s expansion continues to be fueled by emerging mobile‑first nations.
Top 10 Countries by Facebook Users (2025)
| Rank | Country | Users |
|---|---|---|
| 1 | India | 314M |
| 2 | United States | 175M |
| 3 | Indonesia | 119M |
| 4 | Brazil | 109M |
| 5 | Philippines | 84M |
| 6 | Mexico | 82M |
| 7 | Vietnam | 70M |
| 8 | Bangladesh | 56M |
| 9 | Thailand | 50M |
| 10 | Egypt | 44M |
What This Means for Marketers
- Mobile social usage is shaping global trends.
- Audience targeting must be adapted to new demographic realities.
- Localization and language‑specific content will perform better.
3. Facebook Age Statistics: Who Is Using Facebook in 2025?
Facebook’s demographic evolution continues as younger users diversify their platform usage.
Age Breakdown Highlights
- 25–34 remains the largest audience segment.
- 35–44 shows steady growth.
- Gen Z is active but spreads its attention across multiple platforms.
Strategic Insight
Marketers must tailor messaging to older, more financially stable demographics while still nurturing Gen Z engagement with video‑first formats.
You may wan to check our related article : Top 10 TikTok Statistics to Know in 2025
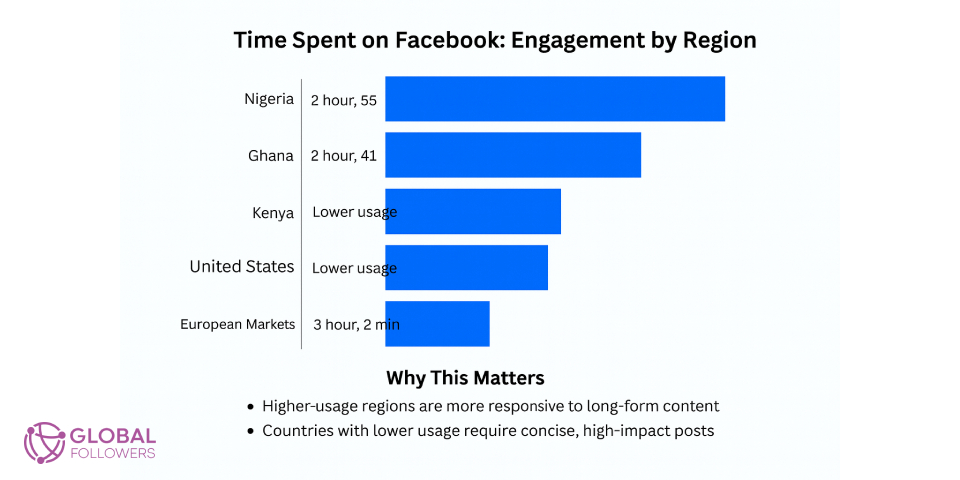
4. Time Spent on Facebook: Engagement by Region
Different regions show drastically different session durations.
Average Daily Facebook Usage by Country
| Country | Time Spent per Day |
| Philippines | 3 hours 2 min |
| Nigeria | 2 hours 55 min |
| Ghana | 2 hours 41 min |
| Kenya | 2 hours 34 min |
| United States | Lower usage |
| European Markets | Lower usage |
Why This Matters
- Higher‑usage regions are more responsive to long‑form content.
- Countries with lower usage require concise, high‑impact posts.
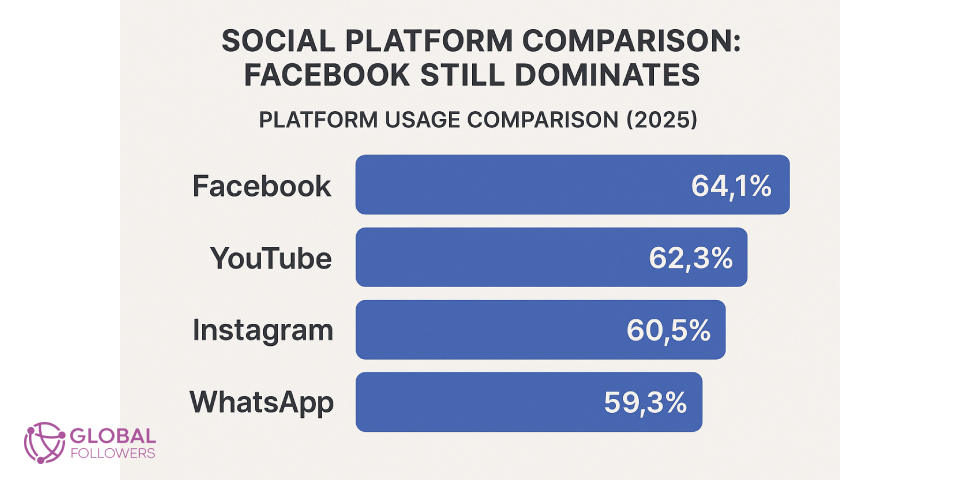
5. Social Platform Comparison: Facebook Still Dominates
In 2025, Facebook remains the most widely used social platform globally.
Platform Usage Comparison (2025)
| Platform | Global Usage Share |
| 64.1% | |
| YouTube | 62.3% |
| 60.5% | |
| 59.3% |
Interpretation
Facebook still holds the broadest cross‑demographic reach despite user fragmentation.
6. Engagement Performance: Benchmarking Facebook
Facebook’s engagement rate averages 0.15%, which is lower than emerging video‑first platforms.
Engagement Rate by Platform
| Platform | Engagement Rate |
| TikTok | 5.53% |
| 0.70% | |
| 0.15% | |
| Twitter / X | 0.03% |
| 0.06% |
Why Engagement Is Lower
- Algorithm prioritizes personal connections
- Increased competition within the feed
- Rise of passive video consumption
Strategic Takeaway
Success on Facebook requires:
- High‑quality video content
- Authentic storytelling
- Smart use of targeting and retargeting
7. Best‑Performing Content Types on Facebook
Video continues to dominate performance metrics.
Content Type Ranking
- Video (including Reels) – Highest engagement & reach
- Images – Moderate performance
- Text Posts – Limited reach
- Link Posts – Lowest reach
Why Video Wins
- Favored in algorithm changes
- Higher retention rates
- Better suited for mobile consumption
8. Posting Frequency: What the Data Really Says
Brands post an average of 43 posts per month, but higher frequency does not guarantee better engagement.
What Actually Improves Engagement
- Posting consistency, not quantity
- Diversified formats (Reels + images + carousel posts)
- Clear value propositions
Facebook Pages Statistics Insight
A thoughtful publishing strategy outperforms high‑volume posting.
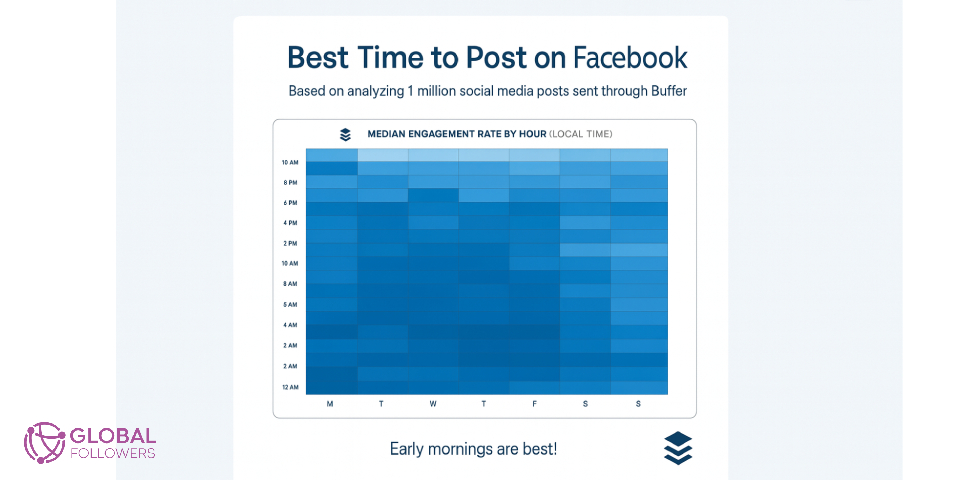
9. Best Times to Post on Facebook in 2025
Data shows clear engagement peaks.
Best Times to Post
- Wednesday, especially 8 AM – 10 AM
Worst Times
- Sunday, with up to 15% lower engagement
Why Timing Matters
")
Seeing a "Facebook Account Temporarily Unavailable" error message when you try to log in is one of those problems that can feel more alarming than it ...

Whether you want a break from Facebook or you're ready to leave permanently, Facebook gives you two options: temporary deactivation and permanent dele...
Facebook’s algorithm rewards early engagement posting at peak times increases content visibility.
10. Influencer Landscape: Why Nano & Micro Influencers Win
The creator economy is evolving, and smaller creators offer exceptional ROI.
Influencer Rate Averages
| Influencer Tier | Average Cost |
| Nano | $100–$500 |
| Micro | $500–$8,000 |
| Mid‑Tier | $10,000–$50,000 |
| Macro | $40,000–$90,000 |
| Mega | $10,000–$25,000+ |
Why They Perform Better
- Strong community loyalty
- Higher trust engagement
- Better alignment with niche markets
📌 What These Facebook Statistics Mean for Your Strategy in 2025
As algorithms evolve and digital demographics shift, the following principles define effective Facebook strategy:
- Optimize for Video‑First Engagement : Reels, long‑form video, and hybrid formats boost retention.
- Use Data‑Driven Audience Insights : Leverage demographic and geographic data to tailor messaging.
- Balance Frequency With Quality : Facebook rewards consistent, meaningful content over volume.
- Focus on Timing : Posting during peak engagement windows increases reach.
- Prioritize Authentic Influencer Partnerships : Nano and micro‑influencers outperform large‑scale accounts.
- Track Marketing Metrics Closely : KPIs such as ad impressions, CTR, cost per result, and content reach must guide decisions.
Whether you’re analyzing facebook marketing statistics, optimizing your content reach, or planning ad impressions, the insights below will help you understand where Facebook stands today and where it’s heading.
If you like our article you can also look up Top 10 Must-Know Instagram Statistics for 2025
Facebook USA Statistics 2025: Key Insights From the U.S. Market
Facebook continues to be one of the most influential social media platforms in the United States in 2025. While overall user growth has stabilized compared to emerging markets, the U.S. remains one of Facebook’s most valuable regions due to high advertising spend, strong purchasing power, and mature digital behavior.
Facebook Users in the United States
- The United States has approximately 175 million Facebook users in 2025
- It ranks second globally in total Facebook users, after India
- User growth is steady, indicating a mature but stable market
This stability makes the U.S. market especially attractive for long-term brand building and performance-driven campaigns.
Facebook Age Demographics in the USA
- The largest user groups are ages 25–34 and 35–44
- Users aged 45 and above represent a significant and growing segment
- Gen Z users are still present but divide their attention across platforms such as Instagram and TikTok
From a marketing perspective, U.S. Facebook users generally have higher disposable income, making the platform effective for conversion-focused strategies.
Time Spent on Facebook in the United States
- Average daily usage is approximately 30–35 minutes per user
- Engagement is lower than in mobile-first regions but more intent-driven
- Users interact most with:
- Video content and Reels
- Facebook Groups
- Local and community-based content
In the U.S., concise and value-oriented posts perform better than long-form updates.
Facebook Advertising and Revenue Impact in the U.S.
- The United States remains Facebook’s largest advertising revenue market
- Advertising costs are higher than the global average, but so is ROI
- Strong performance is seen in:
- Retargeting campaigns
- Video ads
- Lead generation and e-commerce objectives
Advanced targeting and rich audience data continue to give advertisers a competitive advantage.
What These Facebook USA Statistics Mean for Your Strategy
- Prioritize video-first and mobile-optimized content
- Focus on older, financially stable demographics
- Emphasize quality and consistency over posting volume
- Use Facebook primarily for conversion and ROI-driven campaigns
GlobalFollowers Statistics on the Services We Provided to Facebook Users in 2025
In 2025, GlobalFollowers continued to be a leading choice for Facebook users seeking effective growth and engagement solutions. Our Facebook services, including page likes, post interactions, and follower growth, reached more than 150,000 active users over the year.
Thanks to high demand from Facebook pages, creators, and businesses, we delivered over 780,000 Facebook service orders in total. Promotional campaigns and viral content periods saw daily sales volumes rise to exceptionally high levels.
On the support side, our team responded to over 22,000 Facebook-related support tickets and messages, resolving the majority within the same day. This consistent and accessible support helped reinforce trust and long-term relationships with our Facebook user base.

No comments to show.